
Docker-Powered Server Stack
Simply server setup including server monitoring and automatic updates
Are you considering self-hosting your services on a VPS or dedicated root server for the sake of increased privacy? While many opt for a serverless setup, some prefer the control and security of managing their own server. As someone who values complete control over their data, I personally prefer hosting everything on a dedicated host.
Recently, I set up a new server to move some of my services from my NAS behind a dynamic DNS to an always-available server online. In this post, I'll share my server stack, which I use to manage my servers. By following this stack, you too can ensure that you have complete control over your data, without sacrificing convenience.
Now, let's get into the details of my server stack. I've found that using a combination of tools like Docker, Portainer, and Traefik makes it easy to manage my servers. Docker allows me to package my applications and dependencies into a container, while Portainer provides a user-friendly interface for managing my Docker containers. Traefik serves as a reverse proxy and load balancer, ensuring that my applications are always available and responsive.

What Server Size is Right for You?
The size of server that's right for you will depend on your specific needs. Personally, I already use several resource-intensive services, so I opted for a larger server - the Hetzner AX41 - for my setup. This dedicated root server provides ample resources to handle my workload. However, if you don't require a server of this size, you could consider a smaller VPS instead. Ultimately, the right size server for you will depend on your usage requirements and budget

What Operating System should You use?
When it comes to choosing an operating system for your server, the main requirement is that it can run Docker. Personally, I prefer to use Debian because it's an operating system I'm already familiar with. However, I recommend using an operating system that you're comfortable with and that you have experience managing. This can make it easier for you to update your server and perform routine maintenance tasks. Keep in mind that if you opt for an operating system other than Debian, you may need to adjust some of the commands I provide to suit your specific setup.

First steps on the Server
Now that we have a fully operational host with our preferred operating system, it's time to set up some basic security measures. One of the first steps I always take is to disable root login and create a separate user account for myself. This adds an extra layer of security to the system.
To disable root login, simply log in as root and create a new user account with administrative privileges.
# add user and follow instructions
adduser username

# give user sudo/root rights
usermod -aG sudo username
Once you have created the new account, log out and log back in as the new user to make sure everything is working properly. From now on, use the new user account for all administrative tasks, rather than logging in as root.
# test your sudo rights
sudo whoami
Now that we've verified that our new user account is working properly, we can take steps to further secure our system. One important measure is to disable root login via SSH. This helps prevent unauthorized access to the system and adds an extra layer of protection against potential attacks.
To disable root login via SSH, you'll need to modify the SSH configuration file.
# I prefer using nano for exit files
nano /etc/ssh/sshd_config
Look for the "PermitRootLogin" option in the file and set it to "no".
PermitRootLogin noOnce you've made the change, save the file and restart the SSH service to apply the new settings.
service ssh restart
Secure server with Firewall
After disabling root SSH login, the next step is to adjust the firewall settings. Fortunately, if you're using a provider like Hetzner, you may already have an external firewall available that you can configure. In fact, many providers offer this type of option, so you won't necessarily need to install a separate firewall on your server. Simply access your Hetzner server configuration and configure your firewall settings as needed.

When configuring your firewall settings, it's important to only enable the ports that you really need. In my own firewall settings, for example, I typically only enable a few ports, such as 22 for SSH and 80/443 for HTTP/S. If you're setting up a mail server like me, you'll also need to enable the necessary mail ports.
However, in general, it's a good idea to disable all other ports since they aren't necessary for accessing your server. By limiting access to only the ports that you need, you can help reduce the risk of potential security breaches. Additionally, it's worth noting that we want to proxy all requests through Traefik, so we'll be using HTTP requests to access the various services running on our server.
Setup Docker and Docker compose
Now that we've secured our server against some basic attacks, we can move on to setting up the software that we want to install.
One important step is to check the server's timezone and make sure that it's set correctly for your location. This will help prevent any confusion when it comes to scheduling tasks or working with timestamps.
# check current timezone
timedatectl

# adjust timezone (in my case I want Europe/Berlin)
timedatectl set-timezone Europe/Berlin

# now you can check the timezone again
timedatectl
At this point it's always a good idea to check the packages that are currently installed on your system and ensure that they're up to date, even if you've just set up a brand new system. This will help ensure that you have the latest security patches and bug fixes installed.
# check for updates
apt update

# update packages
apt upgrade
Now that our system is up to date, we can begin installing the key software that we'll use to manage our server: Docker and Docker Compose. There are multiple ways to install Docker, but in this case, we'll add the Docker apt repository to our system so that we can easily receive updates alongside our other packages through apt updates.
To install Docker, we need to first enable the use of HTTPS for our system's package manager and add Docker's GPG key. This will allow us to securely download and install Docker packages from Docker's repository. Here are the commands to do so:
apt-get install \
    ca-certificates \
    curl \
    gnupg
sudo mkdir -m 0755 -p /etc/apt/keyrings
curl -fsSL https://download.docker.com/linux/debian/gpg | sudo gpg --dearmor -o /etc/apt/keyrings/docker.gpg
Once the above commands complete successfully, we can add the Docker repository to our system's package sources:
echo \
  "deb [arch="$(dpkg --print-architecture)" signed-by=/etc/apt/keyrings/docker.gpg] https://download.docker.com/linux/debian \
  "$(. /etc/os-release && echo "$VERSION_CODENAME")" stable" | \
  sudo tee /etc/apt/sources.list.d/docker.list > /dev/null
After adding the repository, we can then install Docker and Docker Compose using the following commands:
apt-get install docker-ce docker-ce-cli containerd.io docker-buildx-plugin docker-compose-pluginFinally, we can test if Docker is ready to use and fully set up.
docker psBefore we start deploying containers, it's worth noting that Docker's default log settings can lead to rapidly growing log files that are not automatically rotated or cleared. To prevent this, we can adjust the Docker logging configuration. For example, we can configure the Docker daemon to rotate log files after they reach a certain size, and to retain a specific number of rotated logs. This can be done by modifying the Docker daemon configuration file /etc/docker/daemon.json:
nano /etc/docker/daemon.jsonHere we can add the following settings:
{
    "log-driver": "json-file",
    "log-opts": {
        "max-size": "10m",
        "max-file": "5"
    }
}
This configuration sets the log driver to json-file and limits each log file to a maximum size of 10 megabytes (max-size), and retains a maximum of 5 rotated log files (max-file). You can adjust these values to suit your needs.
After modifying the configuration file, restart the Docker daemon to apply the changes:
systemctl restart dockerSetup Portainer
Now that we have set up Docker and Docker Compose, we can begin deploying our container stack. The first container we need is Portainer, which will serve as our go-to tool for configuring other containers. We will use Docker Compose to set up Portainer, so we need to create a docker-compose.yml file where we can configure our Portainer instance.
cd /opt/
mkdir portainer
cd portainer
nano docker-compose.yml
To set up Portainer, we'll use Docker Compose. We need to create a docker-compose.yml file where we configure our Portainer instance. Our Docker Compose setup should look like this:
version: "3"

services:
    portainer:
        image: portainer/portainer-ce:latest
        container_name: portainer
        restart: always
        ports:
            - 9000:9000
        volumes:
            - /var/run/docker.sock:/var/run/docker.sock
            - /var/docker/portainer:/data
This configuration sets up a Portainer container, mapping the Docker socket so that Portainer can control Docker directly. It also includes a volume mapping for the data directory of Portainer to preserve all settings after an update. The container's port 9000 is mapped to the system port 9000. However, since we previously configured our firewall to only allow ports 22, 80, and 443, we will need to temporarily open port 9000 again for Portainer to be accessible.
Once we have our docker-compose.yml file set up, we can start the Portainer container by running the command docker-compose up -d. This will start the container and pull any necessary images from Docker Hub.
docker compose up -dAfter the Portainer container is running, we can access it by entering the server IP address followed by port 9000 in our web browser. From there, we can configure and manage our other containers using the Portainer user interface.
Setup Traefik
Now that we have Portainer set up, we can use it to configure most of our upcoming containers. However, instead of accessing Portainer directly by IP and port, we want to use a domain and subdomains to access our services and make them secure with SSL encryption. To achieve this, I recommend setting up a reverse proxy called Traefik. Traefik will handle the SSL encryption and routing of incoming requests to the appropriate service container based on the subdomain used to access it.
To set up the Traefik container, we can use Portainer to create a new stack with the following configuration:
version: "3"

services:
    proxy:
        # The official v2 Traefik docker image
        image: traefik:2.9.8
        container_name: traefik
        restart: unless-stopped
        command:
            ## Entrypoints
            - --api.insecure=true
            - --entrypoints.web.address=:80
            - --entrypoints.web.http.redirections.entryPoint.to=websecure
            - --entrypoints.web.http.redirections.entryPoint.scheme=https
            - --entrypoints.websecure.address=:443
            ## Providers
            - --providers.docker
            - --providers.docker.exposedByDefault=false
            ## Let's Encrypt (SSL Encryption)
            - --[email protected]
            - --certificatesresolvers.le.acme.storage=/le/acme.json
            - --certificatesresolvers.le.acme.httpchallenge=true
            - --certificatesresolvers.le.acme.httpchallenge.entryPoint=web
            - --certificatesresolvers.le.acme.tlschallenge=true
            - --certificatesresolvers.le.acme.caserver=https://acme-v02.api.letsencrypt.org/directory
            ## Prometheus Metrics
            - --metrics.prometheus=true
        ports:
            # The HTTP/S ports
            - 80:80
            - 443:443
        network_mode: host
        volumes:
            - /var/run/docker.sock:/var/run/docker.sock:ro
            - /var/docker/traefik/le:/le
This configuration sets up Traefik, which acts as a reverse proxy for all incoming requests on http and https. It also ensures that Traefik has access to all our upcoming services by mapping the docker socket in read-only mode and the volume mapping for the Let's Encrypt certificates enables automatic generation of SSL certificates for all services.
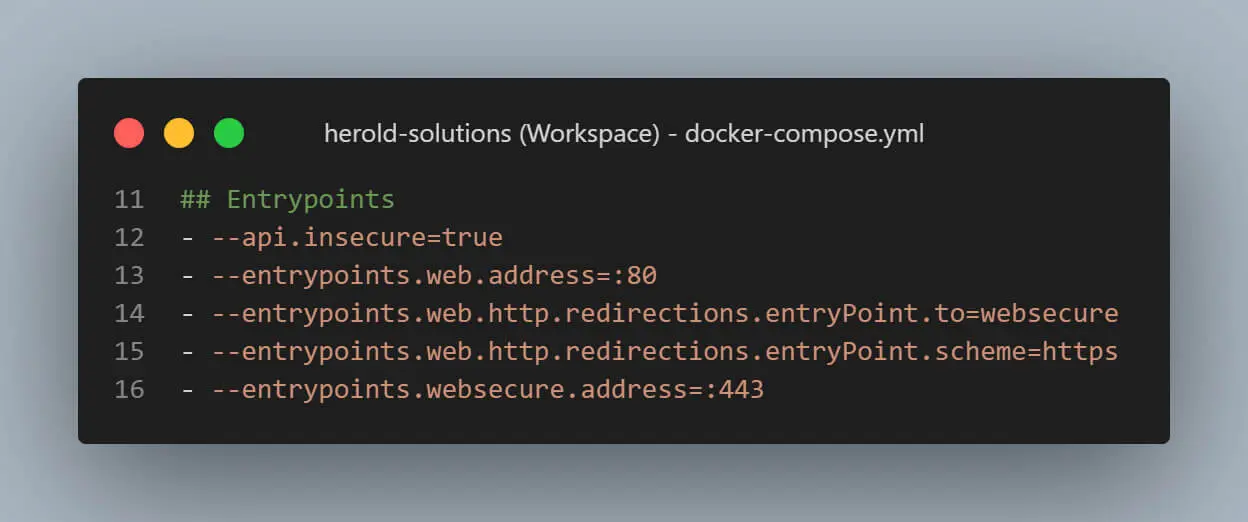
The command section is split into several parts. In the entrypoints section, we define all the entry points that Traefik will use and how they should be handled. The web entry point is enabled on ports 80 and 443, and all requests on port 80 are redirected to port 443 for secure communication.
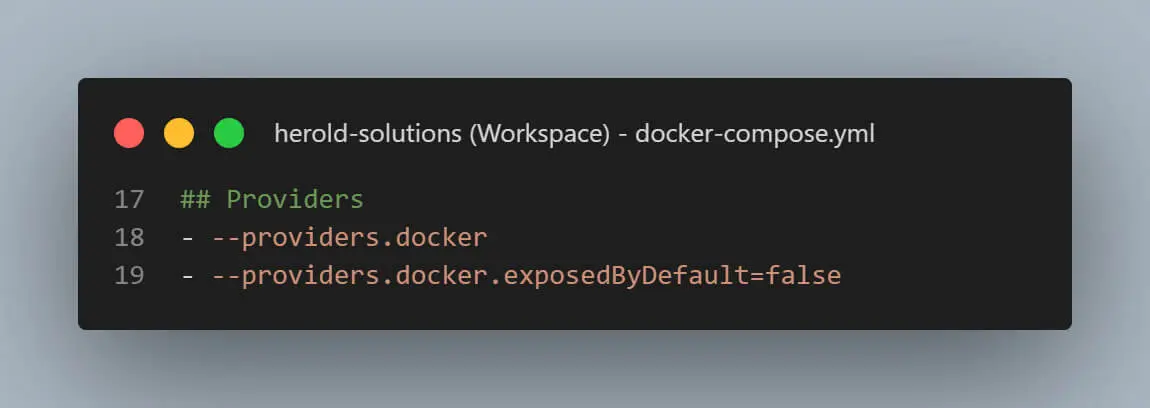
The providers section enables the Docker provider, which automatically checks for new Docker containers and serves them if a new configuration is found. However, we disable exposing services by default, so we have full control of all our services.

The Let's Encrypt section uses automatic certificates in Traefik and creates a resolver named "le" that we can use later in all of our services to ensure they have a valid SSL certificate. The only thing to change here is the email.

Finally, the Prometheus section enables the metrics endpoint of Traefik so that we can collect usage data of our services if we need them. If metrics are not important, you can remove or disable this section.
To configure access to our services, we will be adding additional labels to our container configurations on our stacks, starting with Traefik. Before we proceed, it's important to make sure that we have a valid subdomain added in our DNS for our domain. This subdomain must be valid and resolvable, as Let's Encrypt won't be able to generate a valid certificate for your service otherwise. You can easily check this with a DNS checker tool. Once you've confirmed that your DNS settings are valid, you can proceed with setting up your service.
Now that we've confirmed our DNS settings are working, we can set up our container by adding the following label configurations:
version: "3"

services:
    proxy:
        # The official v2 Traefik docker image
        image: traefik:2.9.8
        container_name: traefik
        ...
        labels:
            - traefik.enable=true
            ## HTTP Routers
            - traefik.http.routers.traefik-rtr.entrypoints=websecure
            - traefik.http.routers.traefik-rtr.rule=Host(`traefik.example.com`)
            - traefik.http.routers.traefik-rtr.tls.certresolver=le
            ## HTTP Services
            - traefik.http.routers.traefik-rtr.service=traefik-svc
            - traefik.http.services.traefik-svc.loadbalancer.server.port=8080
This configuration allows Traefik to act as a reverse proxy for our service. We enable routing access only for the websecure entry point, as we want to forward only HTTPS requests. We set the subdomain for our service and enable our pre-configured Let's Encrypt resolver to generate SSL certificates for it. Finally, we specify the internal settings for our service, including the server port (8080) for the Traefik dashboard.
This configuration is used for all services that we want to reverse proxy through Traefik. However, to avoid duplication in the configuration, we need to adjust the names of the router and the service. For example, if we want to use this configuration for accessing Portainer, we can add folloing lines to our docker-compose.yml:
version: "3"

services:
    portainer:
        image: portainer/portainer-ce:latest
        container_name: portainer
        ...
        labels:
            - traefik.enable=true
            ## HTTP Routers
            - traefik.http.routers.portainer-rtr.entrypoints=websecure
            - traefik.http.routers.portainer-rtr.rule=Host(`portainer.example.com`)
            - traefik.http.routers.portainer-rtr.tls.certresolver=le
            ## HTTP Services
            - traefik.http.routers.portainer-rtr.service=portainer-svc
            - traefik.http.services.portainer-svc.loadbalancer.server.port=9000
After running docker compose up -d, we can access Portainer via our subdomain portainer.example.com. after being sure that this is functinal we can disable our previusly open firewall port 9000 to access portainer
Setup Monitoring
To monitor the status of my server and automate container updates, I use a stack that includes Grafana and Prometheus for metrics, the Prometheus Node Exporter to collect server metrics, and the Watchtower container to automate container updates.
version: "3"

services:
    watchtower:
        image: containrrr/watchtower:latest
        container_name: watchtower
        restart: unless-stopped
        environment:
            WATCHTOWER_HTTP_API_UPDATE: true
            WATCHTOWER_HTTP_API_TOKEN: mysupersecretwatchtowertoken
            WATCHTOWER_HTTP_API_PERIODIC_POLLS: true
            WATCHTOWER_HTTP_API_METRICS: true
            WATCHTOWER_SCHEDULE: 0 0 5 * * *
            WATCHTOWER_ROLLING_RESTART: true
            WATCHTOWER_SCOPE: update
            DOCKER_CONFIG: /config
        volumes:
            - /var/run/docker.sock:/var/run/docker.sock
            - /var/docker/portainer/docker_config:/config
        labels:
            - com.centurylinklabs.watchtower.scope=update

    grafana:
        image: grafana/grafana-oss:latest
        container_name: grafana
        restart: unless-stopped
        user: 0:0
        volumes:
            - /var/docker/grafana:/var/lib/grafana
        labels:
            - com.centurylinklabs.watchtower.scope=update
            - traefik.enable=true
            ## HTTP Routers
            - traefik.http.routers.grafana-rtr.entrypoints=websecure
            - traefik.http.routers.grafana-rtr.rule=Host(`grafana.example.com`)
            - traefik.http.routers.grafana-rtr.tls.certresolver=le
            ## HTTP Services
            - traefik.http.routers.grafana-rtr.service=grafana-svc
            - traefik.http.services.grafana-svc.loadbalancer.server.port=3000

    prometheus:
        image: prom/prometheus:latest
        container_name: prometheus
        restart: unless-stopped
        user: 0:0
        ports:
            - 9090:9090
        command:
            - "--config.file=/etc/prometheus/prometheus.yml"
            - "--storage.tsdb.path=/prometheus"
            - "--storage.tsdb.retention.size=25GB"
            - "--web.console.libraries=/usr/share/prometheus/console_libraries"
            - "--web.console.templates=/usr/share/prometheus/consoles"
        volumes:
            - /var/docker/prometheus/config:/etc/prometheus
            - /var/docker/prometheus/data:/prometheus
        labels:
            - com.centurylinklabs.watchtower.scope=update

    node_exporter:
        image: prom/node-exporter:latest
        container_name: node_exporter
        restart: unless-stopped
        network_mode: host
        pid: host
        volumes:
            - /:/host:ro,rslave
        labels:
            - com.centurylinklabs.watchtower.scope=update
first we will look at our watchtower stack this is configured so that we schedule our update to one update check at 5AM and update one container after another but only the container that got the update label. we also add this lable to this container as we want to automatic update it. we also map our portainer configuration into the watchtower to be able to access the credentials that we probably will set their later for private container repository.
Moving to the next set of containers, we have our metric tracking stack. To access Grafana as our metric dashboard from outside, we need to configure the Traefik settings accordingly. For Prometheus, we set the maximum space usage to 25GB. This ensures that Prometheus will start deleting the oldest data once it reaches the limit. With 25GB, we should have enough storage for several years' worth of data. Additionally, we need to set up a mapping for a prometheus.yml file. Once we start the stack, we can create this file.
nano /var/docker/prometheus/config/prometheus.ymlAnd add the following configuration:
global:
    scrape_interval: 15s
    evaluation_interval: 60s
    scrape_timeout: 10s

scrape_configs:
    - job_name: "prometheus"
      static_configs:
          - targets:
                - "SERVERIP:9100"

    - job_name: "node"
      static_configs:
          - targets:
                - "SERVERIP:9100"

    - job_name: "traefik"
      static_configs:
          - targets:
                - "SERVERIP:8080"

    - job_name: "watchtower"
      metrics_path: "/v1/metrics"
      bearer_token: mysupersecretwatchtowertoken
      static_configs:
          - targets:
                - "watchtower:8080"
Note that you need to replace SERVERIP with your server's IP address. After creating the prometheus.yml file, we restart the monitoring stack, and Prometheus can start scraping our server for data.
To set up Grafana, start by configuring the Prometheus data source under Configuration > Data Sources. Add a new Prometheus data source, set the server IP with port 9090 as the URL, and test the connection. Once this is working, you can add some dashboards.
Here are my three main dashboards that I use:
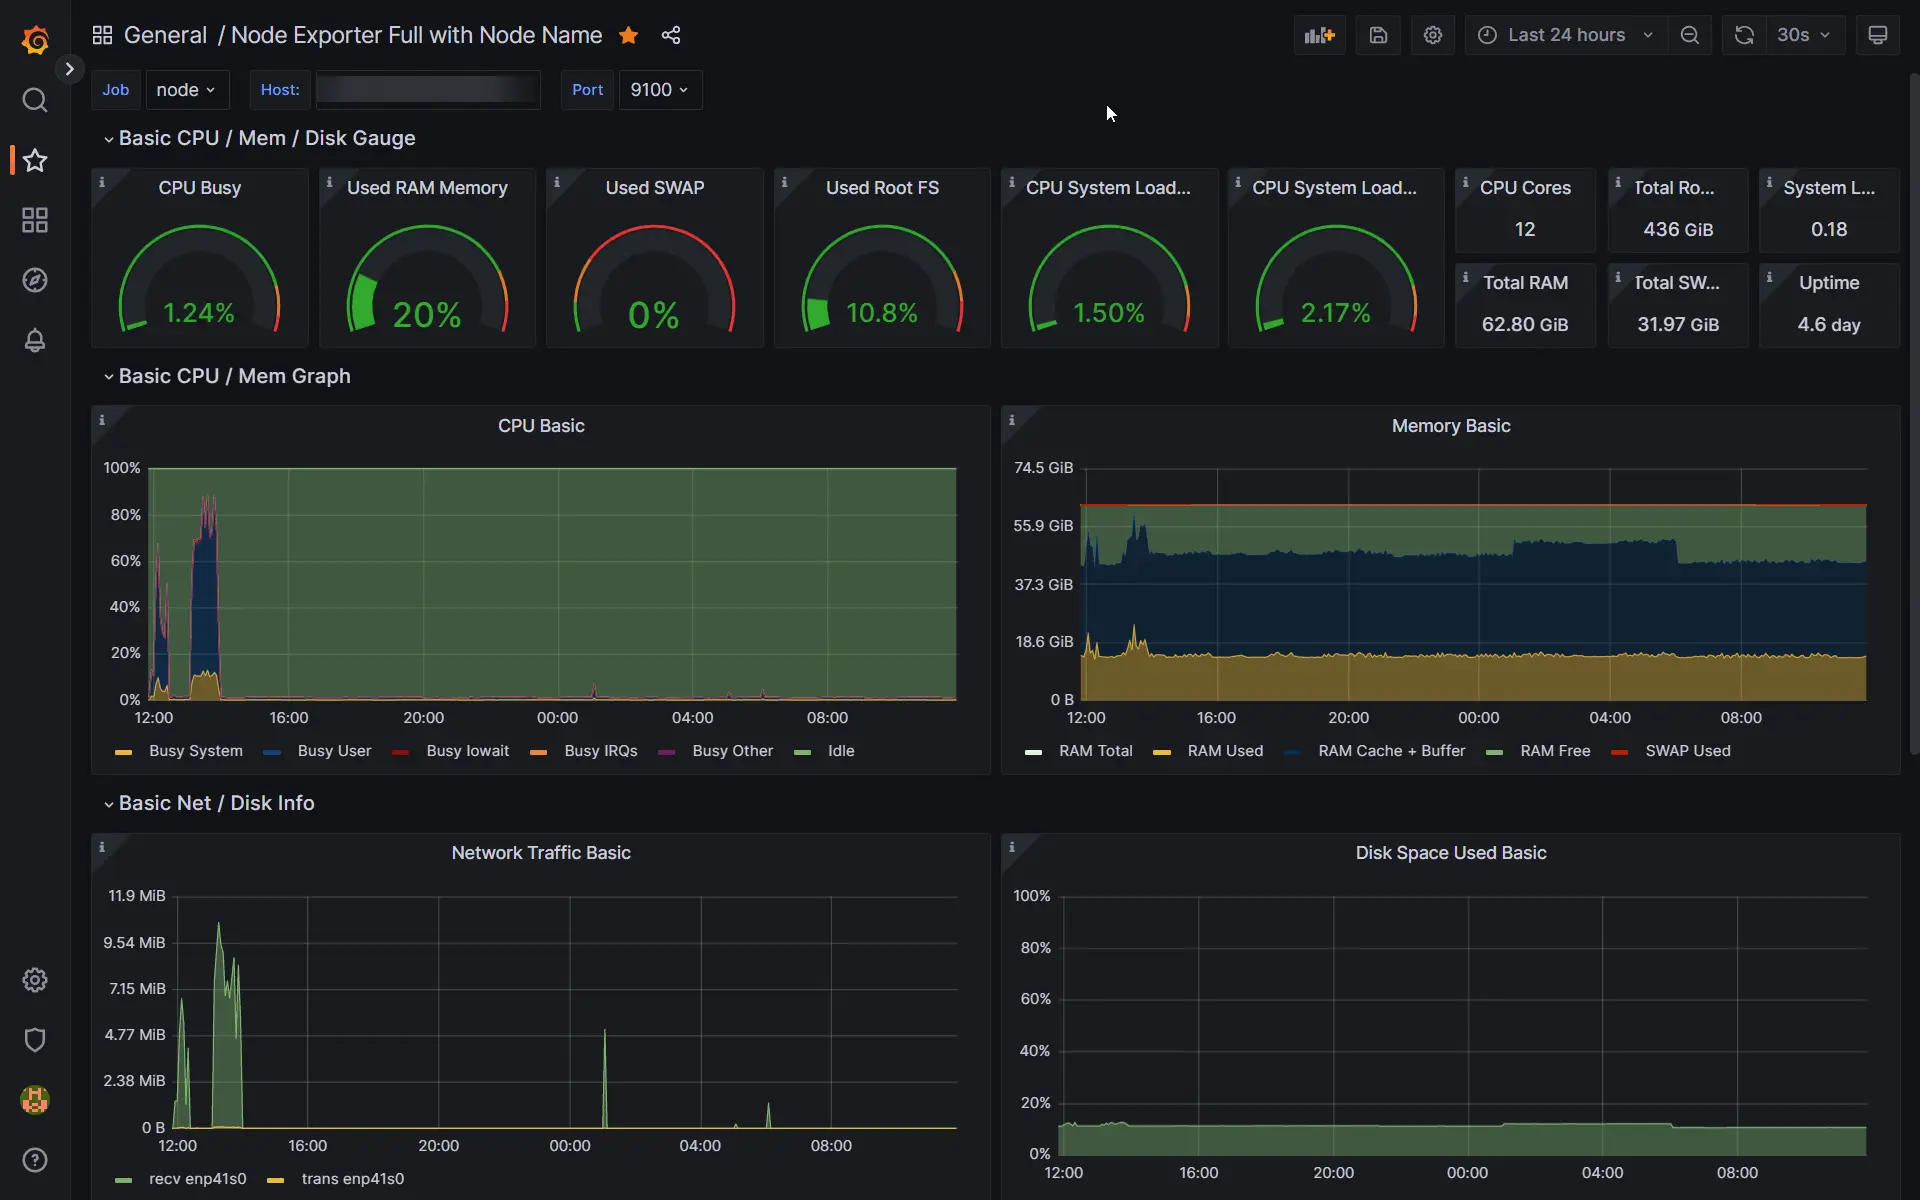
Node Exporter Full with Node Name - The first dashboard shows the server resource usage, providing a good overview of CPU, RAM, and disk usage so that I can check if I need to make changes or free up space.
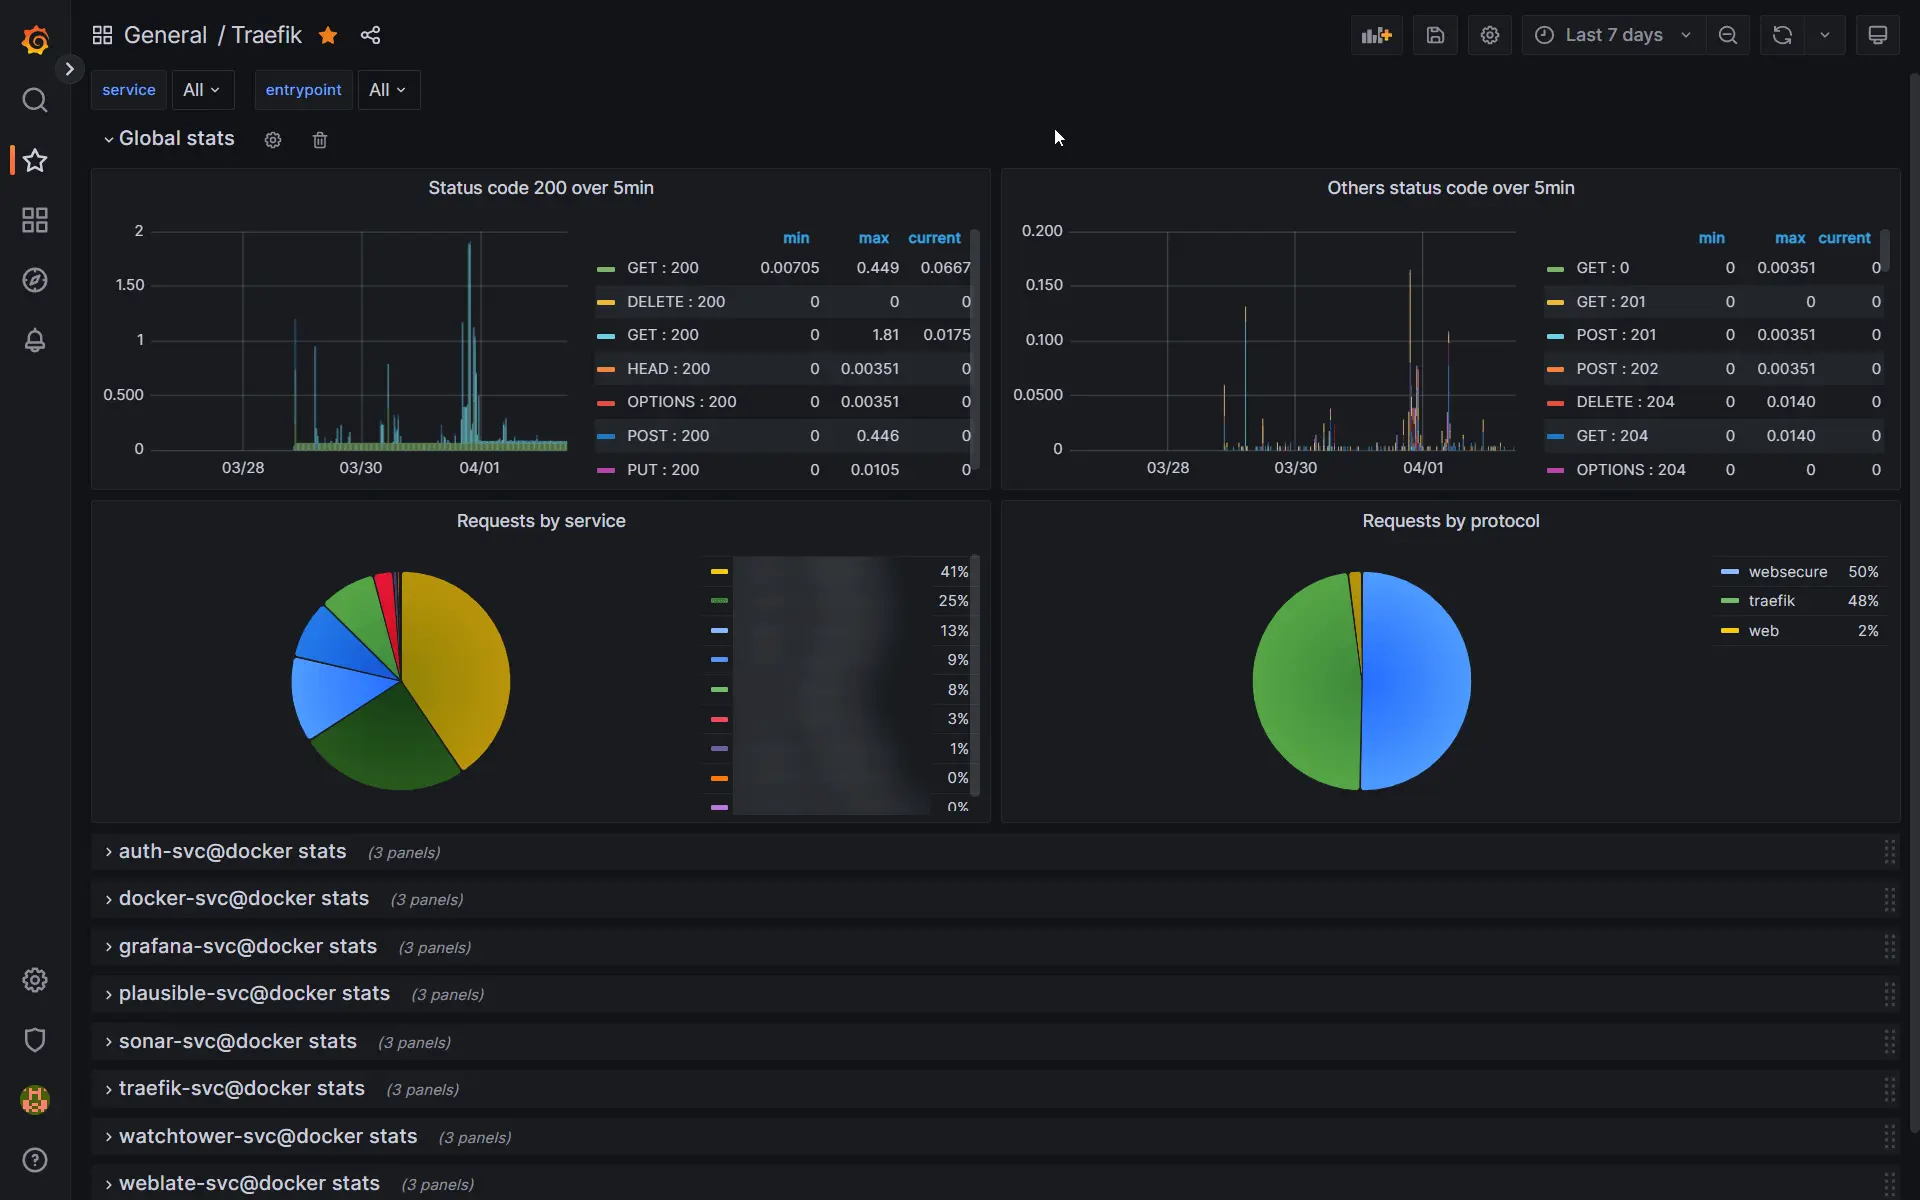
Traefik - The second dashboard monitors the usage of all services proxied through Traefik. I can see which services are used the most and check their response times.
Watchtower - The last dashboard is for Watchtower, where I can check how many services are being checked for updates and if any updates have been installed or failed.

With these dashboards set up, you can easily monitor the health of your server and ensure that everything is running smoothly.
Conclusion
In conclusion, setting up a personal server can seem daunting, but with the right tools and guidance, it can be a rewarding and fulfilling experience. We covered the basic steps to get started, from setting up a virtual private server, configuring a firewall, installing Docker, configuring Traefik as a reverse proxy, and setting up monitoring with Grafana and Prometheus. Remember to always prioritize security, keep your server up to date, and regularly monitor its usage. If you have any questions or problems, feel free to contact me on Twitter or via email. Good luck with your personal server journey!